
Note: This section pertains to Scatter Plot graphs only. Curve fits cannot be applied to Time Series graphs.
When data is displayed in a Scatter Plot, it can be useful to include the equation of a line for the purpose of predicting values that may not be shown on the graph. It can also help in visualizing trends from a large array of data points.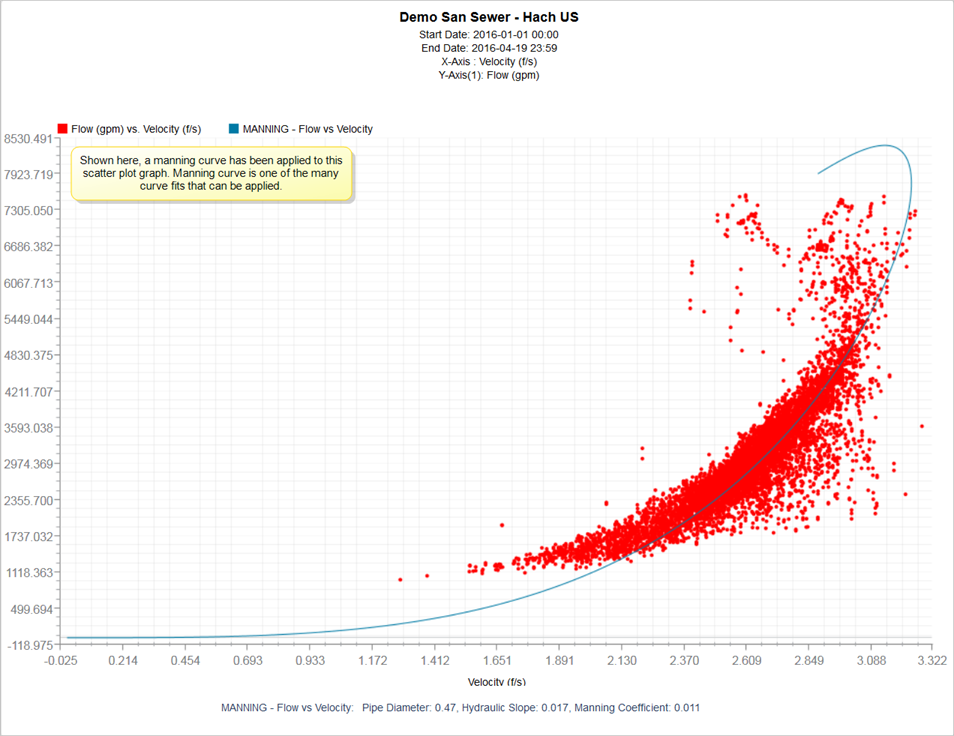
In this Document:
Inserting a New Curve Fit
To create a new curve fit and apply it to a Scatter Plot graph:
- With your graph open, click Tools in the Graphing Toolbar. A drop-down menu will appear.
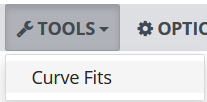
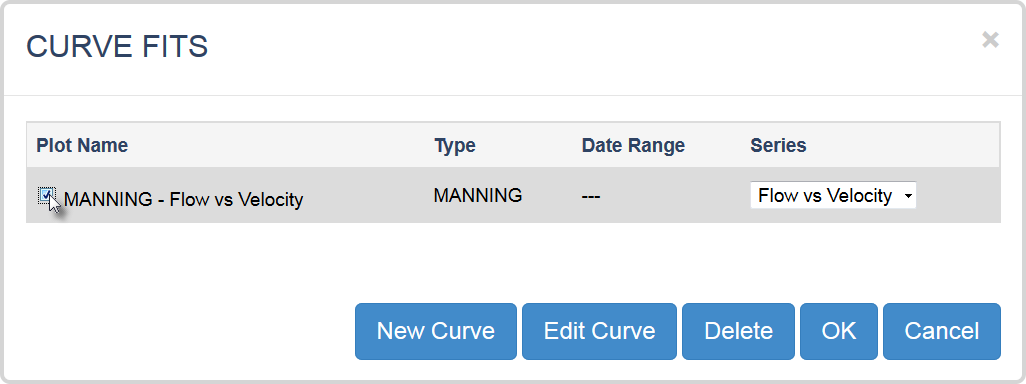
- Click Curve Fits. The Curve Fits window will open.
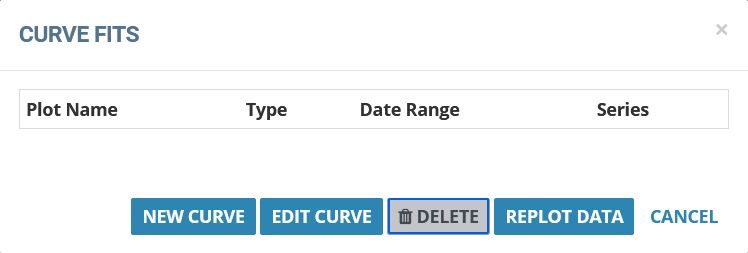
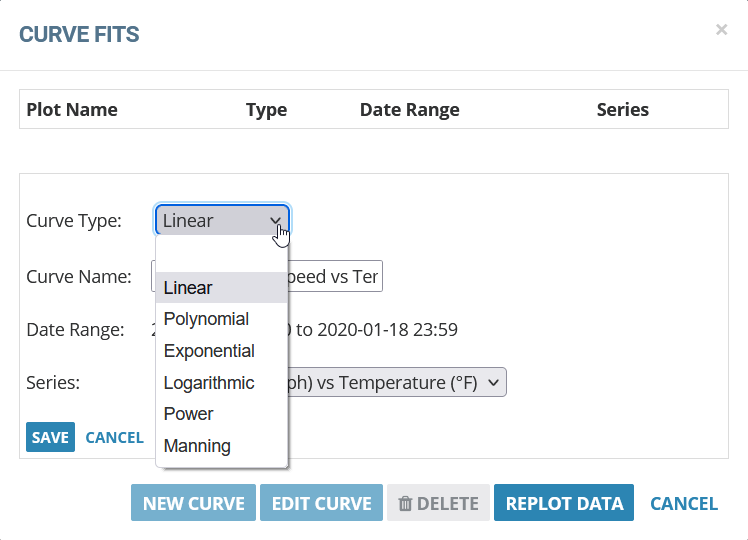
- Click New Curve. The Curve Fits window will expand, revealing a few options.
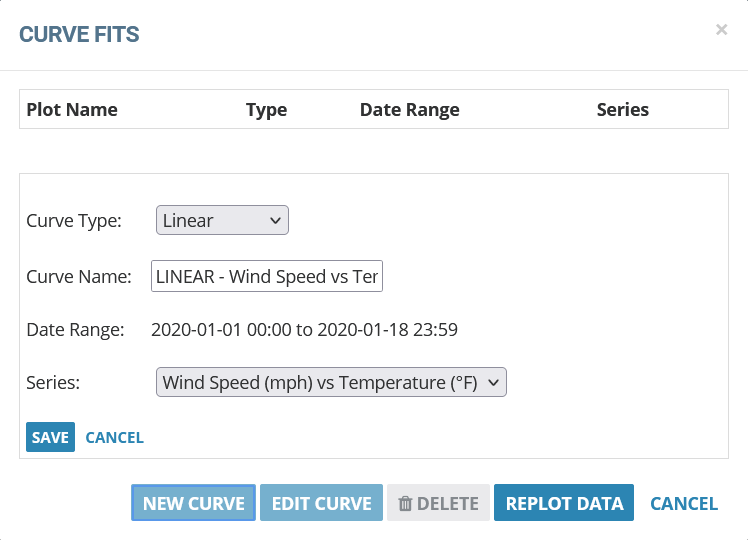
- Choose a desired curve type from the Curve Type drop-down menu. Upon choosing a curve type, the window will expand to reveal options for your selected curve type. Each curve type comes with its own set of considerations, some of which you must know beforehand before proceeding (e.g. Manning Curve).
- Set up the curve fit by completing the necessary fields below the Curve Type drop-down menu.The image below shows the fields for a Manning curve as an example.
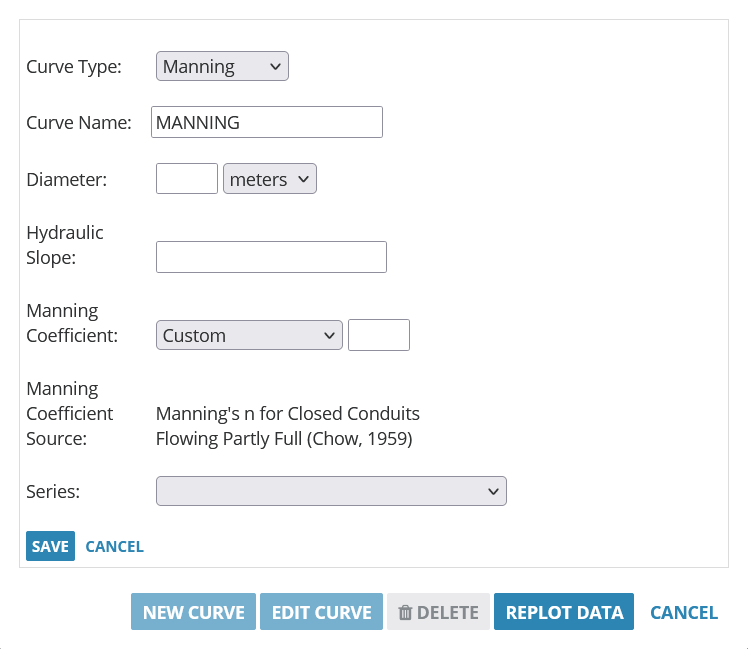
Note: It is required that some prudent information for your curve fit be known beforehand. For example, creating a Manning curve requires that you know the diameter and materials of the associated pipe, as well as the hydraulic slope. To find out what information is needed for a curve fit, select a desired curve type from the Curve Type drop-down menu; the window will expand with a list of details needed to set up the curve fit.
- Click Save. The Curve Fits window will refresh, revealing the updated list of available curve fits, where your newly created curve fit will appear.
- Tick your new curve fit from the list.
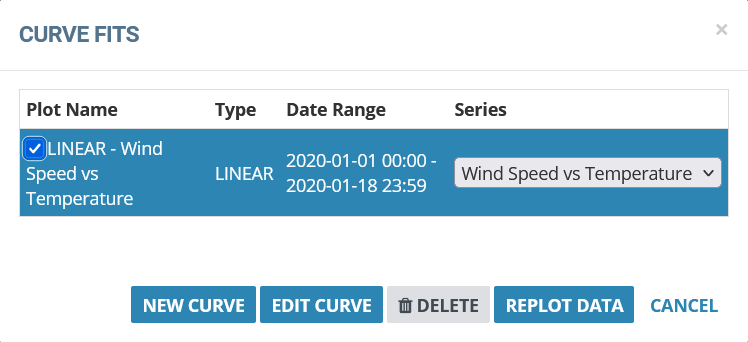
- Click Replot Data. Your graph will refresh, with the curve fit applied.
Inserting a Saved Curve Fit
You can apply a previously saved curve fit to any of your Scatter Plot graphs. This saves time from having to redo a curve’s settings.
To apply a previously saved curve fit to a graph:
- With your graph open, click Tools in the Graphing Toolbar. A drop-down menu will appear.
- Click Curve Fits. The Curve Fits window will open, revealing a list of existing curve fits.
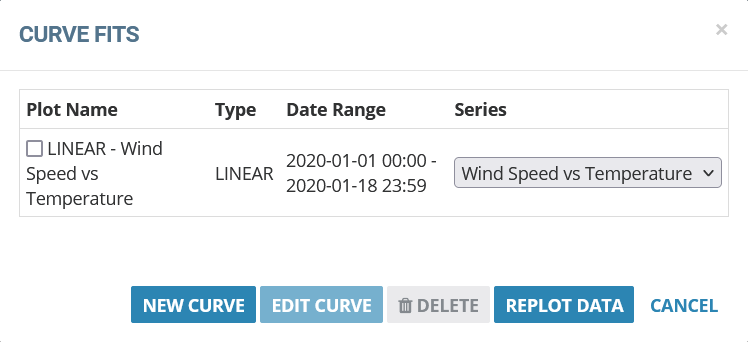
- Tick your previously saved curve fit from the list.
- Click Replot Data. Your graph will refresh, with the curve fit applied.
0 Comments