
You can export all data you have graphed as a single CSV file, right from the Graphing Tool.
With your desired channels plotted on a graph, follow the steps provided in this article.
1. Click Export
When you click Export in the Graphing Tools menu, a drop-down menu will open showing the two download options.
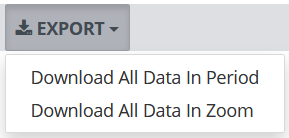
2. Choose Download Type
Choose the type of download you want.
- Download All Data in Period: All the graphed data in the full range defined by the start and end dates
- Download All Data in Zoom: Only the graphed data in the range defined in the zoom window.
A CSV file with the selected data will download. You can open it either from your web browser, or from the folder you have configured to receive browser downloads.
0 Comments