
So, you have two pipes carrying storm water and they feed into a third pipe. You have instruments recording the flow in the third pipe and one of the feed pipes (we’ll say pipe 1). For the moment, we will ignore gains and losses, as these are outside the scope of this demonstration.
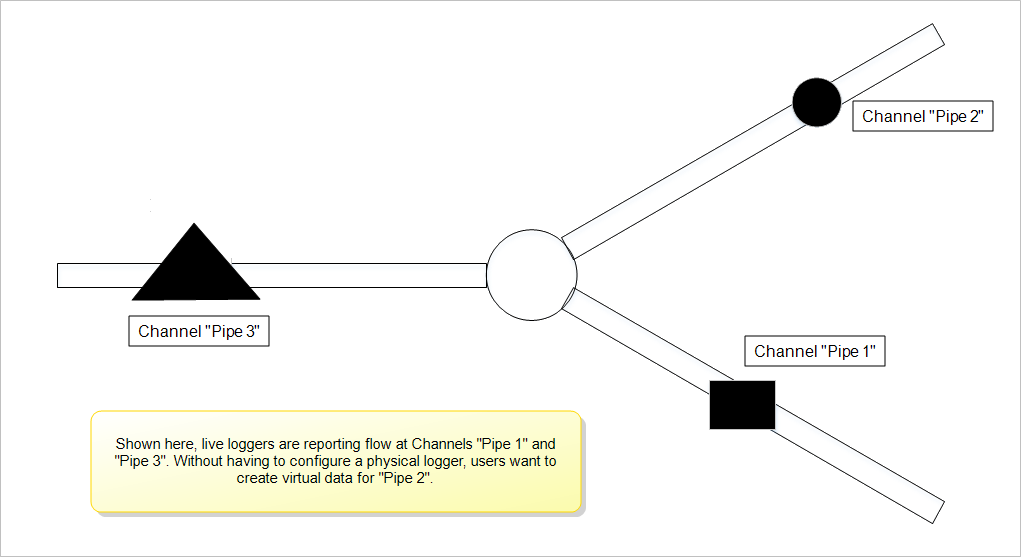
Thus, we will proceed on the assumption that the “sum” of the two pipes feeding the third is the resulting flow from the two source pipes. We have instruments watching the “third” pipe and one of the two “source” pipes (Pipe 1). Given all of the assumptions we’ve stated, the difference between the sum (the flow in Pipe 3) and that coming in via Pipe 1, has to be the flow of Pipe 2. This is trivial until someone actually wants a report printed, or even worse, a graph that includes the sum and both of the sources.
Rather than having to fire up a spreadsheet, import some numbers, and figure out how to plot it all, you can quickly take advantage of the FlowWorks Advanced Calculation Engine’s (FACE) ability to work with multiple Sites.
The Process for Making a Phantom Channel is Twofold
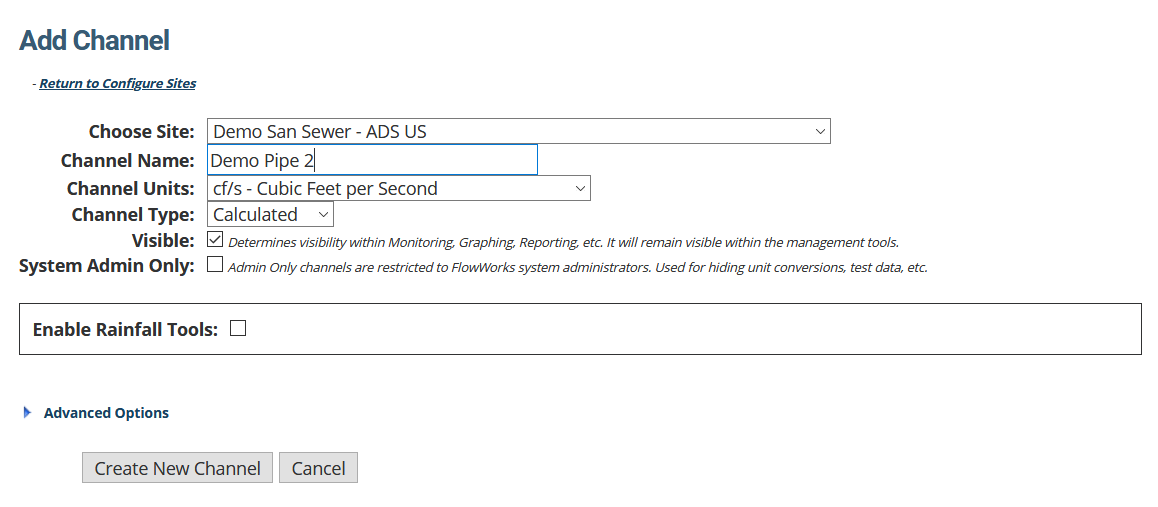
- Start by Creating a Calculated Channel. Once complete, you will need to proceed to step 2, which is discussed in this article. The image below shows channel setup for this example.
This article is a continuation from the article, Create a Calculated Channel. From step one, it is assumed that you are back at the Configure Sites Page, after having completed setup of a new calculated channel.
- Configure a FACE formula that commands the system to create a phantom site with data from more than one channel.
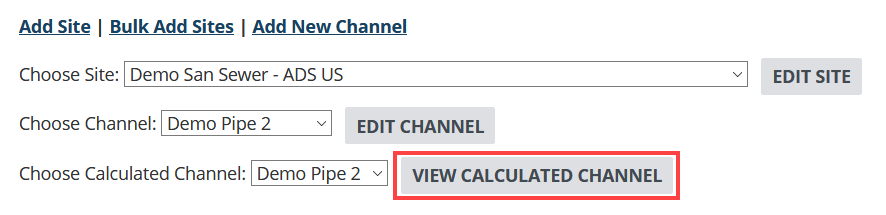
1. Open the Calculated Channel You Just Created
- Use the Choose Site dropdown locate the site that contains the channel with the calculation you wish to use. The page will refresh, revealing channels and calculated channels under this site.
- Use the Choose Calculated Channel dropdown to select the channel that contains the calculated channel you wish to configure.
- Click View Calculated Channel.
2. Click Create Calculation
This will take you to the page where you will configure the calculation.

3. Configure the Phantom Channel
This page has three distinct sections - the following steps take you through each part, beginning from the top of the page.
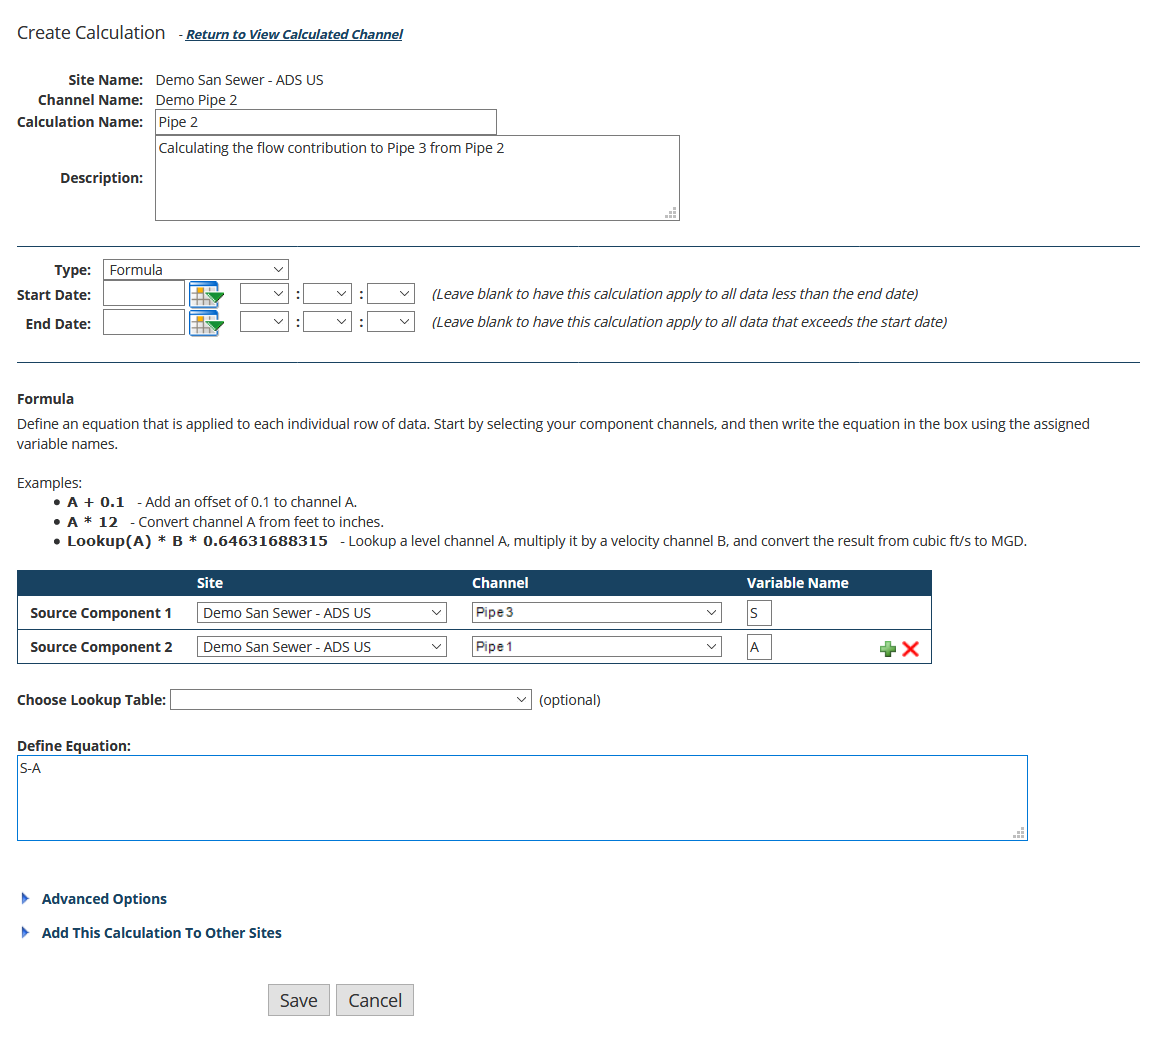
- Provide a Calculation Name and (optional) Description.
- Select Formula for Calculation Type.
- Ignore Start Date and End Date.
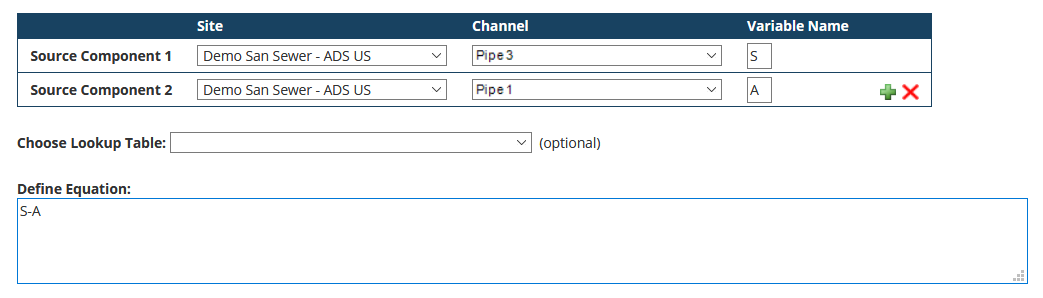
We want this channel to be filled with data points for the entire data stream we have available. - Choose the Source Component.
Source 1 is going to be the channel we're calling "Pipe 3", and we will call it variable S since it is the SUM of the other two pipes. Click the drop-down arrow in the Site box and locate the Site that the Channel resides in. Use the 'plus' button to add a second source component. For Source 2, locate the channel we're calling "Pipe 1" . - Leave Choose Lookup Table blank.
- Define the equation.
We are creating the calculation that will produce data points to fill the phantom flow Channel. If S = A + B, then B (the flow from the phantom Site "Pipe 2") will be equal to S – A. Thus S-A is our equation.
4. Click Save
You can now go to graphing and plot both the raw data channels and the Calculated channel. Graph for any time period you wish, and you will see that you have two sources and one sum.
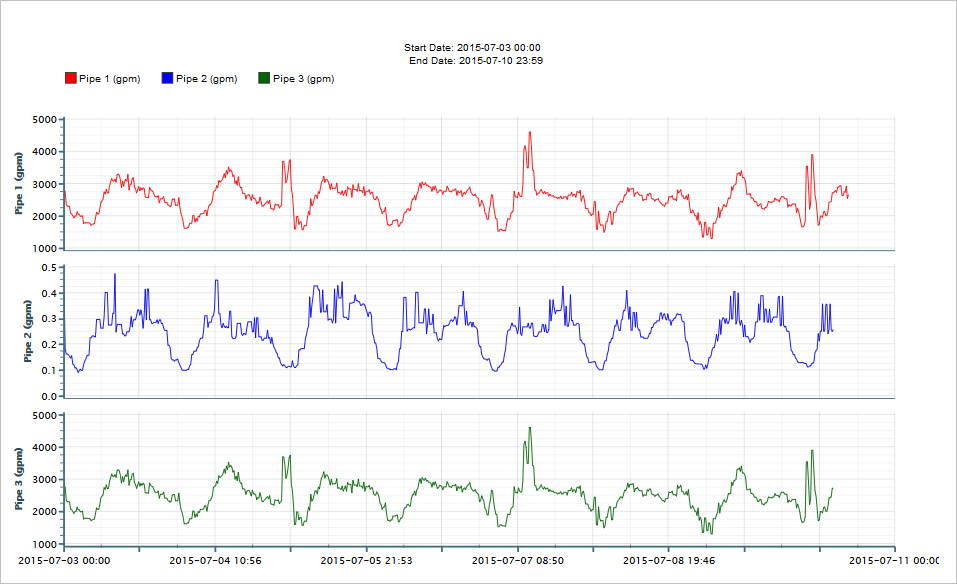
This method demonstrates how you can use FACE to calculate new virtual data from two or more Channels. You can hand off this report or graph without the need to explain yet again how come you have measurements from Pipe 1 and Pipe 3 but not Pipe 2. We won’t tell them how you did it if you don’t.
0 Comments