
The Data Viewer table is used in conjunction with a graph to identify the numerical values of a particular datapoint.
To identify the value of a datapoint on a graph using Data Viewer:
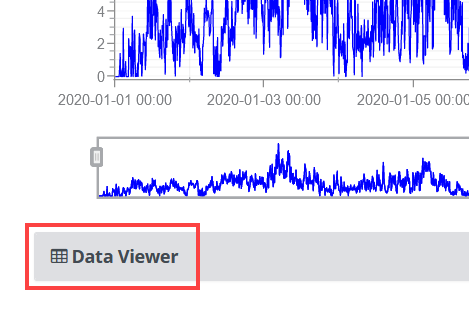
- Expand the Data Viewer. With your graph open, click Data Viewer, found below the Zoom Window.
- Find the datapoint you want to review. Left-click anywhere on the graph; the Data Viewer will scroll to the data that corresponds with the point that you clicked on the map.
You can also print the data contained in the Data Viewer. To learn how, refer to the Printing a Graph documentation.
0 Comments