
If your graph's plot style is set to 'Point' or 'Point + Line', you can alter the appearance of both the point and the line. This can be handy in situations where your graph has more than one channel plotted, and you wish create visual distinctions between them. On the other hand, you can follow these directions if you wish to streamline the appearance of all graphed channels.
This feature is not available for scatter plot graphs.
1. Plot a Graph
For information on how to plot a graph, refer to the Create a New Graph (General Steps) documentation.
Alternatively, you can open a saved graph. Please refer to the Open a Graph documentation for details.
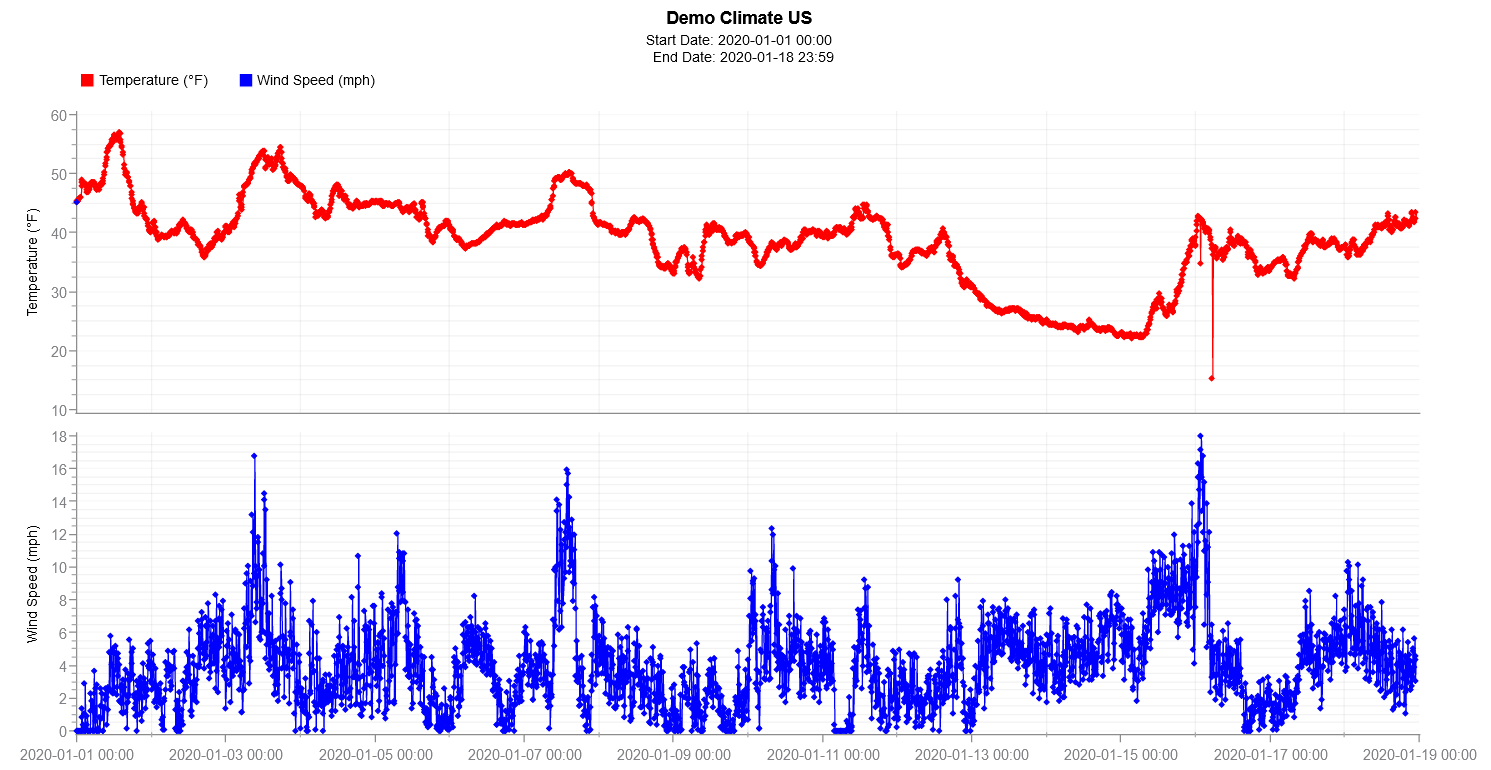
The example given in this article will demonstrate how to change the point type of the following graph.
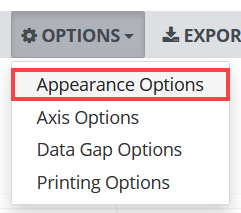
- With your graph open, click Options from the Graphing toolbar.
A drop-down menu appears. - Click Appearance Options.
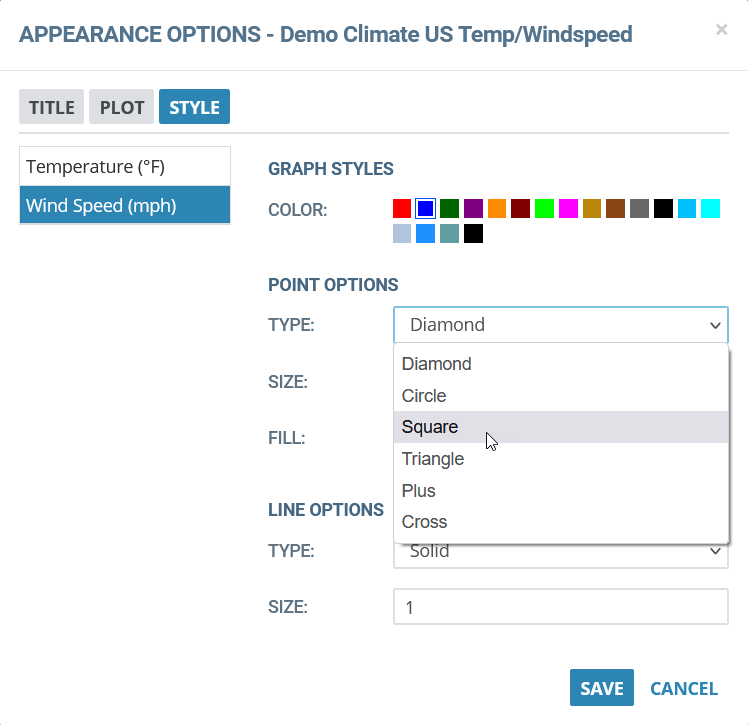
3. Click the Style Tab
4.Edit the Channel Styles
Go through each channel one-by-one, choosing a new Point Type and / or Line Type for each one.
In this example, we will modify the point type for the two channels from diamonds to circles and squares, and the line type from solid to dashed and dotted, respectively.
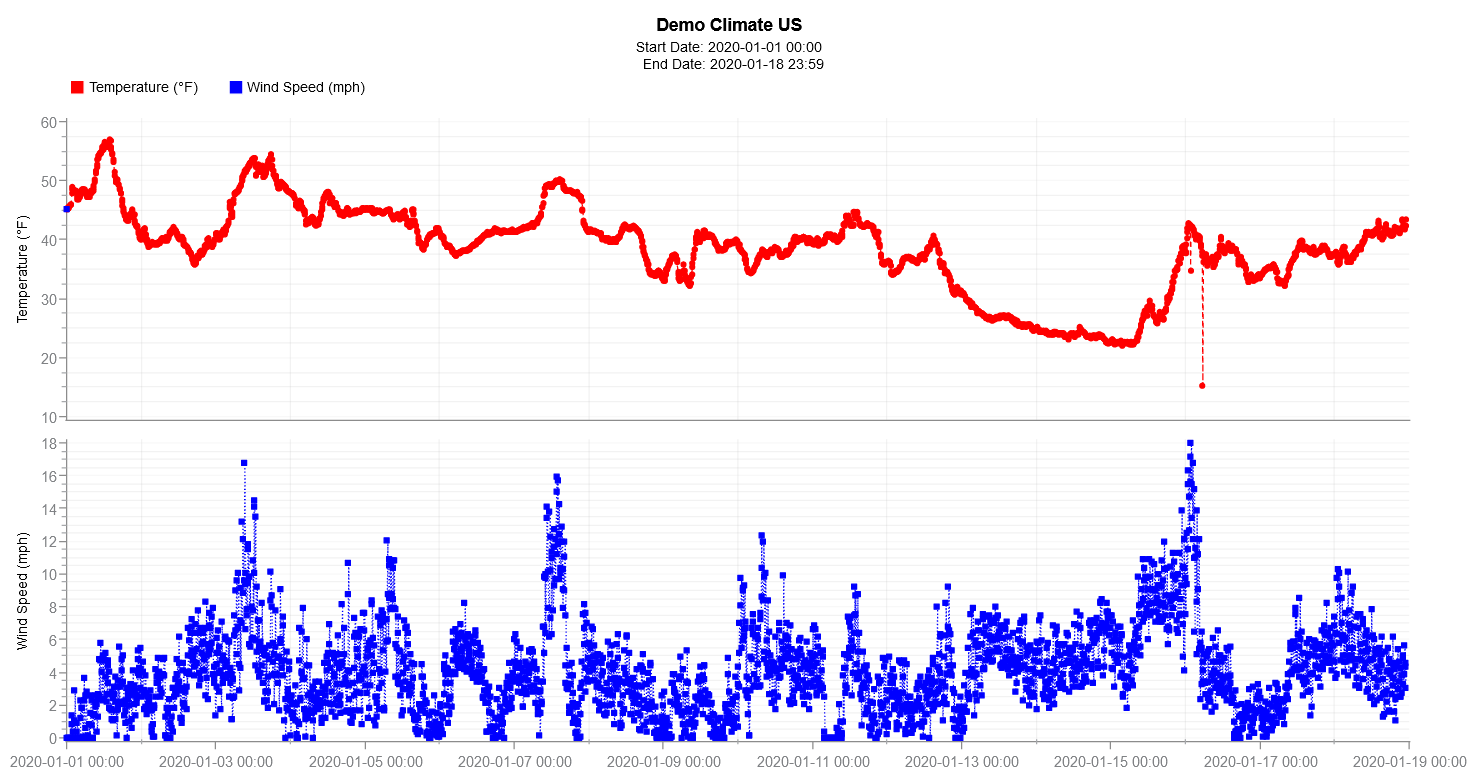
5. Click Save
The graph will refresh with updated point and line types.
Remember to save the graph if you wish to keep your changes. See Save a Graph for details.
0 Comments