
Now that you have created a dry weather pattern and storm event group, you are now ready to configure the RDII Charts and generate a Correlation Graph. You can quickly toggle between both RDII Chart View and Correlation Graph view at any time. This enables you to make changes to your RDII Charts on the fly, and easily view the effects of those changes on the correlation chart.
After having opened the desired I&I project, follow these directions to begin reviewing the RDII Charts:
1. Click Create Correlations
- Starting from the Project Dashboard, click Create Correlations.

2. Configure RDII settings for Correlations
These settings will apply to all RDII Charts/Correlation Graphs in the set, however you will be able to modify the settings for each study in the set in later steps.
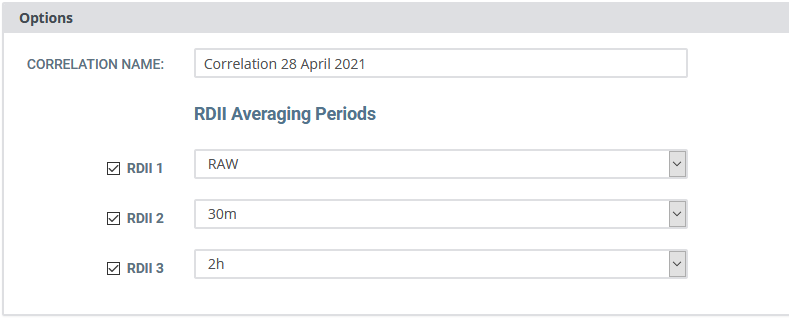
- Set the RDII Averaging Periods using the drop-down lists.
You can have up to three. Use the check-boxes to toggle on/off an RDII averaging period across all RDII Charts. - (Optional) Enter the number of Pre-storm Days to Plot.
By default, each hydrograph shows the flow signal for the duration of a storm. This option allows you to plot the flow signal for any given number days leading up to the storm event. - (Optional) Enter the number of Post-storm Days to Plot.
Similar to "pre-storm days to plot", this option allows you to plot the flow signal for any given number of days following the storm event. - (Optional) Enter the number of minutes for Time Shift DWP (max +/- 1440 minutes).
This moves the entire WP signal forward in time on each RDII Chart.

3. Configure the Site Specific Details
- Enter a Correlation Set Name.
All RDII Charts and Correlation Graphs in the set will be saved with this name. - Use the check-boxes under Create to select the flow sites you want to include in the correlation set.
The tool will generate one Correlation Graph for each site. - For each flow site you chose, use the drop-down menus to select the following for the RDII Charts/Correlation Graphs: a) a Flow Channel; b) a Dry Weather Pattern; c) a Rainfall Site; a Storm Event Group (to compare with the respective flow site. Only those SEGs that use the selected rainfall site will be listed).

4. Click Create Correlations

You are presented with data for the first flow site in the set, starting with the first RDII chart for the corresponding storm event group. 
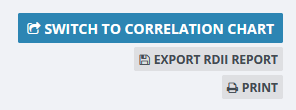
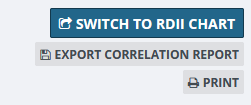
You can toggle between Correlation Graph view and RDII Chart view at any time. From RDII Chart view, click Switch to Correlation Chart; from Correlation Graph view, click Switch to RDII Chart.
At any time during RDII Chart or Correlation Graph review, you can modify the Correlation Name and RDII Averaging Periods for the study you currently have open. These settings will not propagate to the entire correlation set (the other flow sites used in the set). Expand the Options panel found at the bottom of the page. Any modifications to these settings are automatically applied.
In the following steps, you will learn the basic steps associated with reviewing the RDII charts for the first flow site in the set. Once you are finished, you can proceed to repeating these steps for the second flow site in the set, then the third, etc. Remember, you can see how changes to your RDII Chart affects the Correlation Graph at any time. For details on how to review the Correlation Graph, see section, Reviewing the Correlation Graph.
5. Review the RDII Charts
There is one RDII Chart (flow hydrograph) for each storm event in the study. For each, do the following:
- (Optional) Modify Storm Settings. Changes made here will apply only to the visible RDII Chart. Click Refresh to apply your changes.
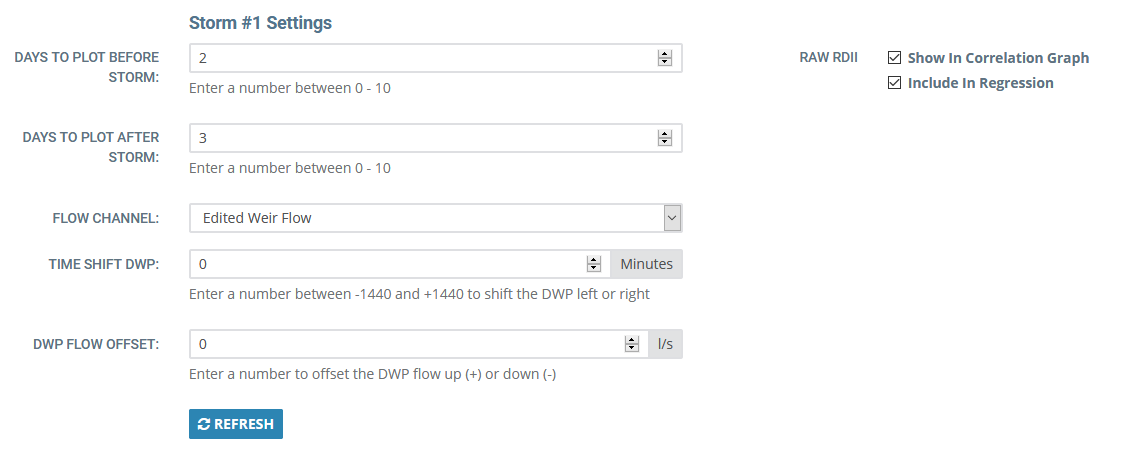
- Choose whether you want to include the storm event in the Correlation Graph. If you wish to include it, activate the Show In Correlation Graph check-box, next to the RDII averaging period(s) you wish to use.
For each storm event, you can choose whether to include it in the Correlation Chart using a particular RDII averaging period. In Correlation Graph view, you will be able to review the graph using any one RDII averaging period at a time. If a storm event is not selected to be shown in Correlation Graph view with a particular RDII averaging period, it will not be visible in the Correlation Graph when you are using that particular RDII averaging period.
For each RDII averaging period you activate, you have the additional option of including or excluding the storm event from the calculation of the regression line. Activate Include in Regression to have the storm event included in the determination of the regression line. If you un-check this option, the event will still appear in the Correlation Graph (because you have Show in Correlation Graph activated), but the storm event will not be included in determining the slope of the regression line.

- Click Next Storm to view the next RDII Chart in the Storm Event Group.

- Repeat steps 5.1 to 5.3 until you have finished reviewing all storms in the group.
6. Export RDII Report
You may optionally Export RDII Report in a CSV format for review.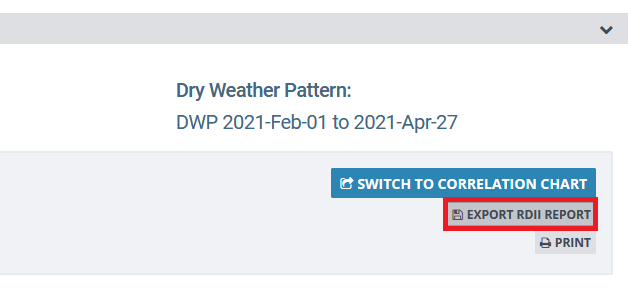
7. Click Save and Next
Click Save and Next to view RDII Charts and the Correlation Graph for the next flow site in the chart. Repeat step 5.
If you are using only one flow site in the set, click Save. The Project Dashboard populates.
At any time during RDII Chart review, you can click Switch to Correlation Chart to review the correlation chart. This allows you to instantly see how changes to RDII settings affect the correlation chart, so that you can tailor the correlation chart to your needs fast. The tool will produce one correlation chart for each flow site in the correlation set.
From Correlation Graph view, the same button change to say Switch to RDII Chart. At any time, you can click this toggle back to RDII Chart view.
Below is an example of a Correlation Graph. 
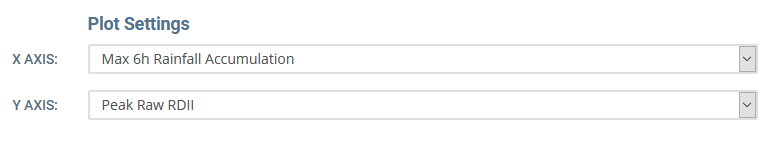
Under Plot Settings, you will find the ability to modify x-axis and y-axis settings:
- X-Axis: Use this menu to change the period of maximum rainfall accumulation.
- Y-Axis: Use this menu to change the RDII averaging period used in the correlation graph.
Any storm events that are marked to be shown in the correlation graph, but excluded from determining the slope of the regression line, will be represented by a yellow plot (instead of green). The image below points to such a storm event. 
You can export correlation data to a CSV file. From the Correlation Graph View, click Export Correlation Report. The file will be made available from the folder in which your browser is configured to store downloaded files. With some web browsers, you can conveniently open the file via the browser window.

When you are finished reviewing the Correlation Graph, you can either click Save Correlation to complete Correlation setup, or Switch RDII Chart to go back to RDII Chart view. If you decide to go back to RDII Chart view, begin from Step 5 in the previous section to continue.
When complete, save your work. You are taken back to the Project Dashboard, where the RDII Chart and Correlation you've created for each flow site in the set are now available the Correlations list.

0 Comments