
You can use the Multi-Graph Review tool to simultaneously display multiple graphs that were already created in the Graphing Tool. You begin by choosing the graphs you would like to review, and then proceed to selecting a date range and interval to apply to all graphs. You can save settings if you plan to repeatedly review the same group of graphs. Please note that only graphs that were configured and saved in the Graphing Tool will be available in Multi-Graph Review.
This article describes how you can create a graph review.
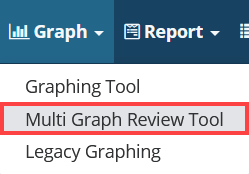
1. Open Multi-Graph Review
- Click Graph from the main toolbar.
- Click Multi-Graph Review Tool.
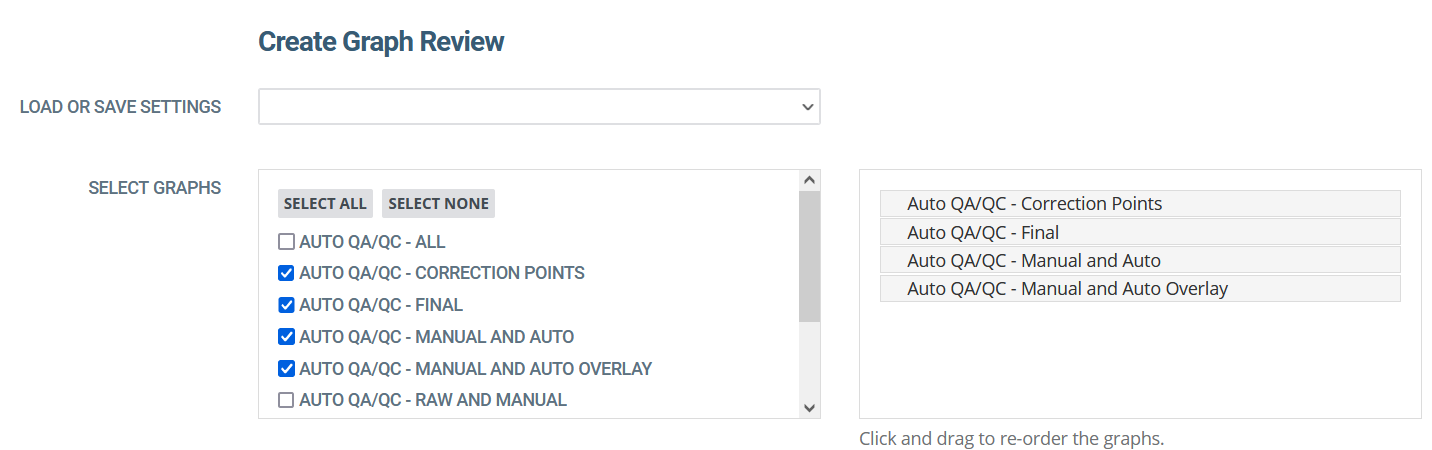
2. Select the Graphs to be Included in the Review
The selected graphs will appear in a list to the right of the page.
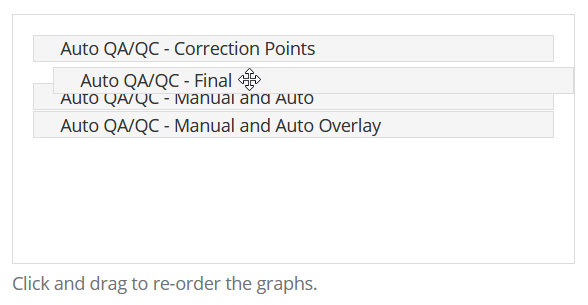
3. (Optional) Click and Drag List Items to Re-Order
The graphs in your output will appear in the order as shown in this list. You can click and drag an item modify the order.
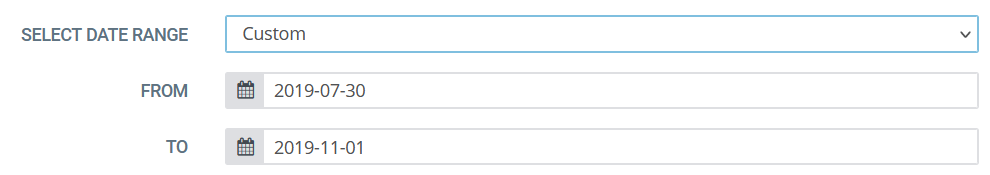
4. Select a Date Range to Review
You can use the drop down list to select a predefined date range; or you can input dates in the To and From fields.
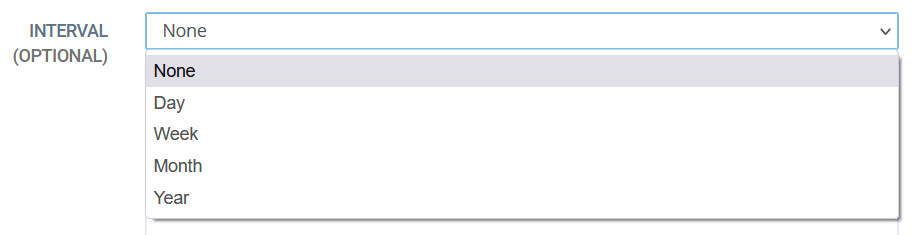
5. (Optional) Set an Interval to Create Graphs Within the Calendar Date Range.
You can output graphs every x interval within the date range specified in the previous step. For example, if you needed to produce graphs for each month of last year, you would set the date range to 'Last Year', and the interval to 'Month'. This would produce 12 graphs for each site selected. Use carefully as you can quickly generate hundreds or even thousands of graphs!
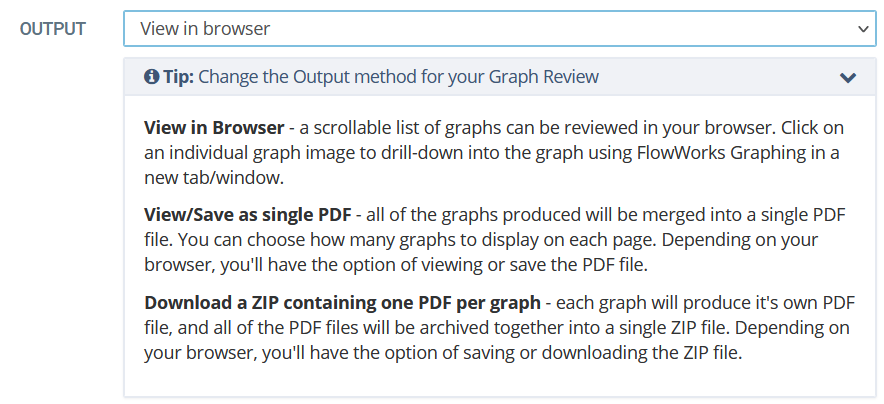
6. Choose an output method
View in Browser - a scrolling list of graphs that can be reviewed in your browser. Click on an individual graph image to drill-down into the graph using FlowWorks Graphing in a new tab/window.
View/Save as single PDF - all of the graphs produced will be merged into a single PDF file. You can choose how many graphs to display on each page. Depending on your browser, you'll have the option of viewing or save the PDF file.
Download a ZIP containing one PDF per graph - each graph will produce it's own PDF file, and all of the PDF files will be archived together into a single ZIP file. Depending on your browser, you'll have the option of saving or downloading the ZIP file.
7. (Optional) Save settings
This is useful if you plan to repeatedly view the same graphs using the same settings.
- Expand the Load of Save Settings list.
- Click Create New.
A text box appears. - Enter a settings name.
- Click Save.

8. Click Create Graphs

A dialog box will appear, notifying you of the number of graphs to be generated and the approximate required time. Click OK to continue.

9. Review your graphs
Graphs will be generated either in browser, or in a PDF, depending on your chosen output type.
0 Comments