
The rainfall intensity report displays maximum rainfall intensities for select rainfall gauges over a period of time.
To create a new rainfall intensity report:
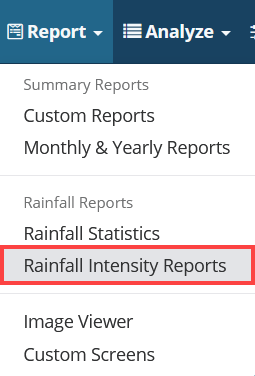
- Click Report. A drop-down menu appears.
- Select Rainfall Intensity Reports. This opens the Rainfall Intensity Report page.
-
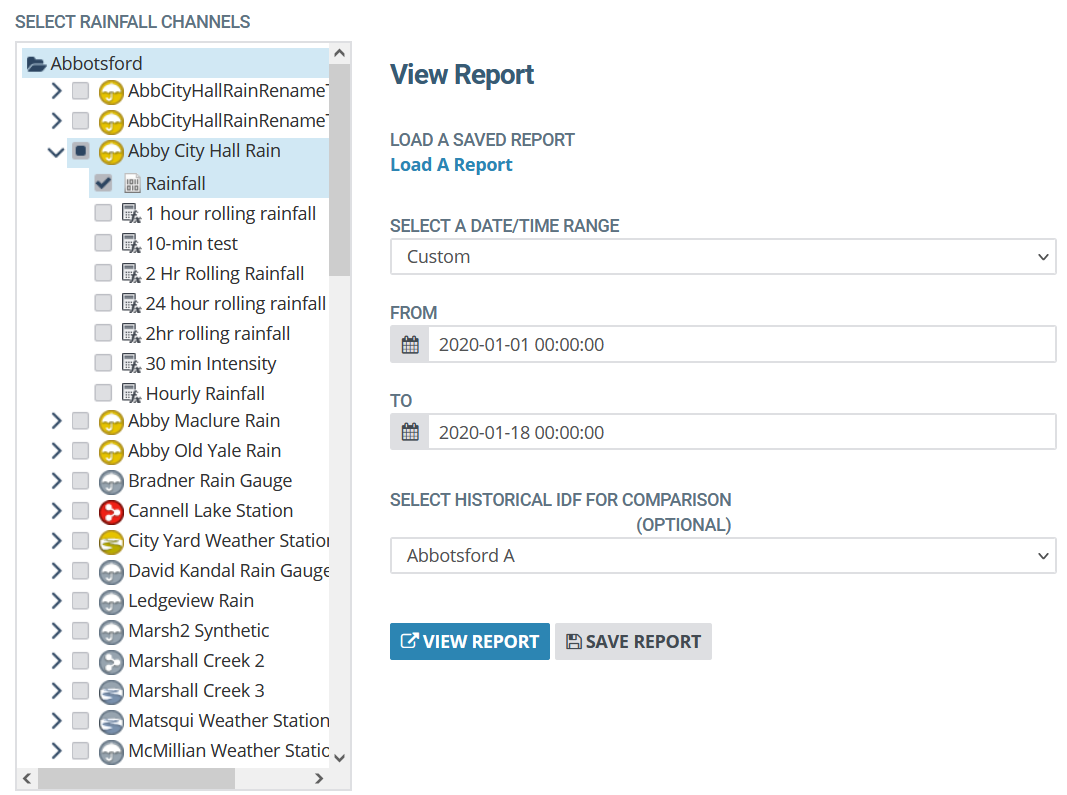
Check the rainfall Sites to include in the report. Navigate through the Site list (left panel) to make your selection.
- Choose New Report... from the Reports drop-down menu.
-
Select a date/time range. Either use the drop-down menu to choose a pre-made date range; or manually enter dates in the From and To fields.
-
Optionally, select historical IDF for comparison, using the drop-down menu.
Below is an example of a completed form:
-
Optionally, click Save Report. The Save Report box appears, where you can enter a name for the new report. Click Save Report when complete.
You can later load the report from the Rainfall Intensity Report page.
- Click View Report. A separate tab opens in your web-browser, where the report is displayed.
This is the result of our example setup:
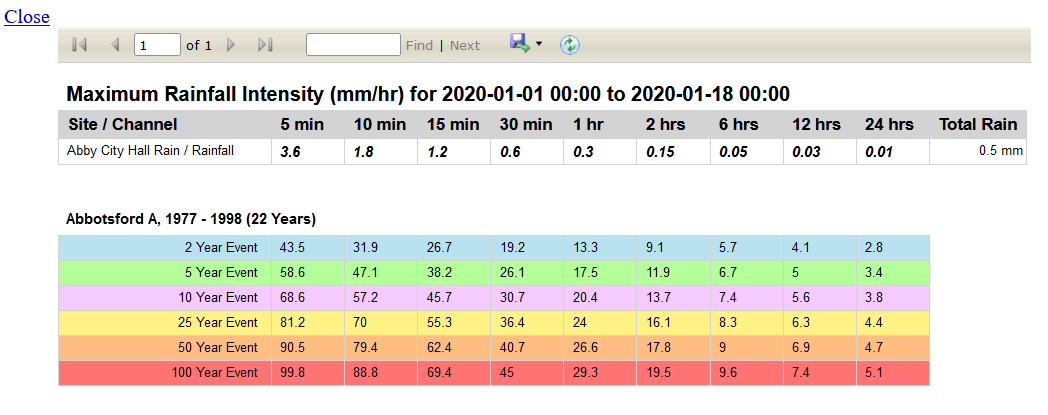
The first table gives us the maximum rainfall intensities for a host of time periods. The second table contains the historical IDF data you chose to include.
Looking at the first table, cells highlighted in a particular color indicate that the rainfall event exceeded the relative historical maximum value.
The report's top panel contains buttons for browsing through the various pages. As well, there is a search function, in which you can input full or partial words or numbers to have the system highlight areas that match your search criteria. Use the Export drop-down menu to open data export options - you can convert your report to an Excel file (xlsx), PDF, or Word file (docx).
0 Comments