
The Rainfall Statistics Reporting tool is used for generating monthly summary reports of your rainfall data, that includes hourly totals by day, and maximum amounts of rainfall over various periods.
1. Open the Rainfall Statistics Tool
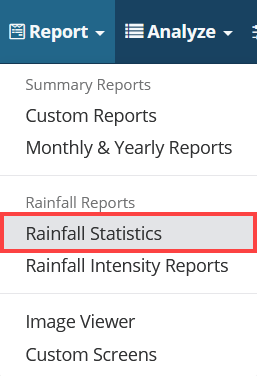
- Click Report from the main toolbar.
- Click Rainfall Statistics.
2. Configure Report Settings
- Select the Site that contains the rainfall Channel you wish to use, using the drop-down menu.
- Choose a Rain Channel.
The system will automatically select the site's rainfall channel, if there is just one. If there is more than one, expand the drop-down menu and select the channel you want to use in the report. - Choose the reporting Year.
- Choose the reporting Month.
- (Optional) Configure Highlight Condition When options.
Optionally, you can have the system highlight the report at instances when rainfall exceeds a certain amount (same units as the rainfall channel used), and for a given number of hours thereafter. Use the Highlight When area to set this up.
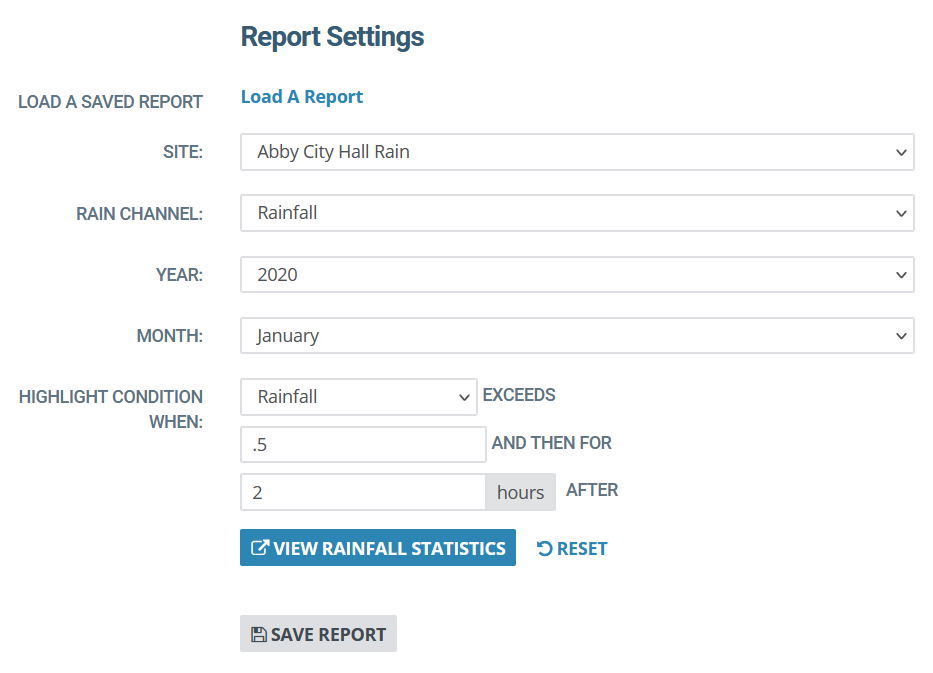
3. Click View Rainfall Statistics
Interpreting the Report
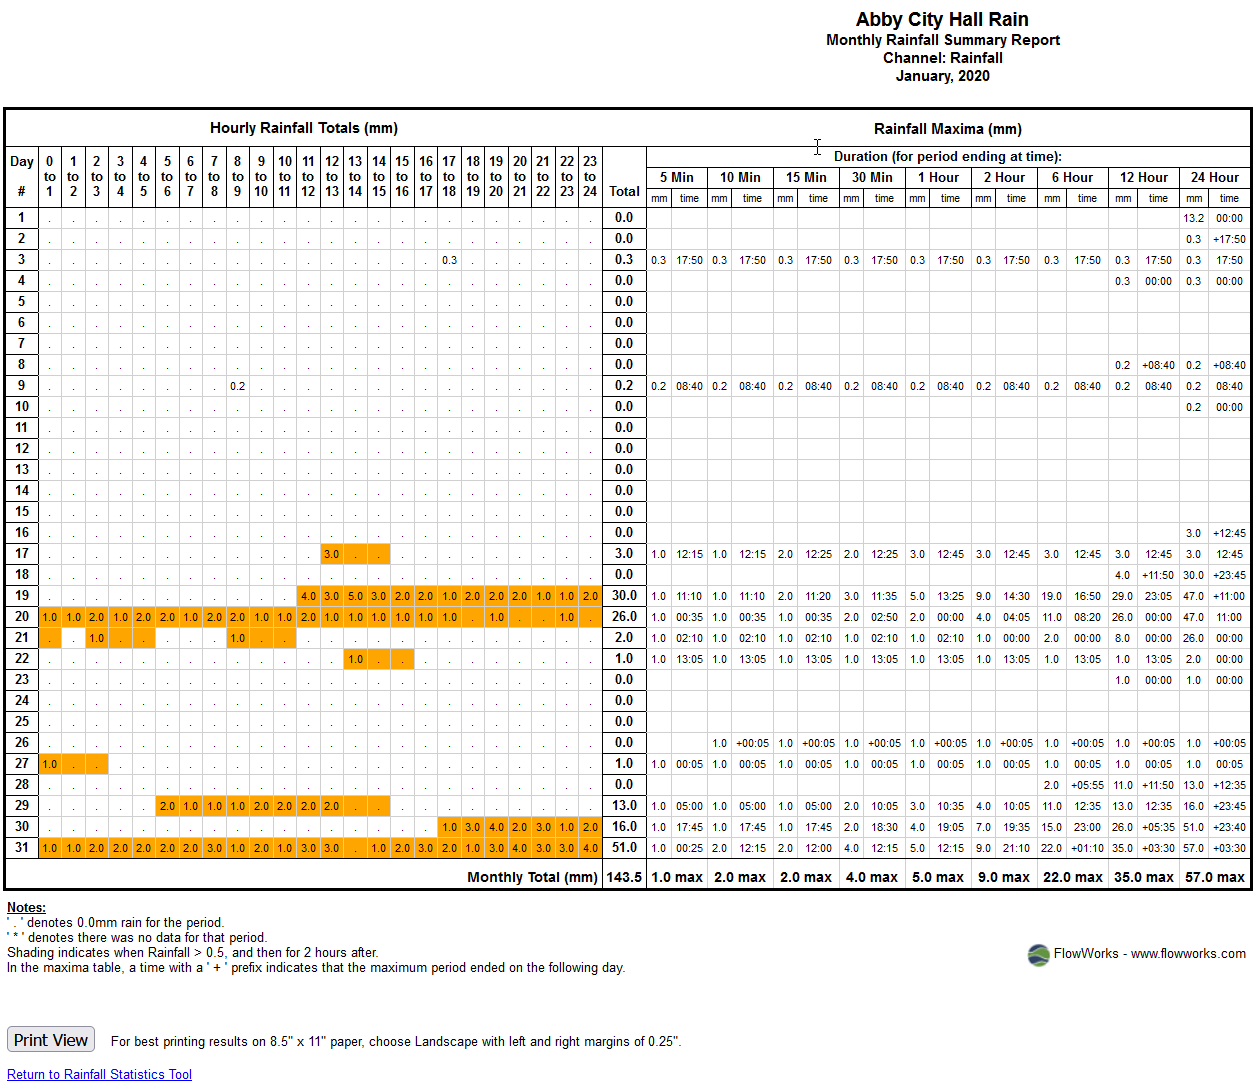
This report is divided into two sections: Hourly Rainfall and Rainfall Maxima.
Hourly Rainfall Totals
The left side of the report shows total rainfall based on the day and hour.
- Boxes that contain a point/period indicate no rainfall during that period.
- Boxes that contain asterisks indicate that there is no data available or that the data has been invalidated.
- Boxes highlighted in orange indicate when rainfall exceeded 0.02mm (as per our Highlight When settings). Since we configured the report to highlight 1 hour after, the box following each instance is also colored.
Daily Rainfall Totals
- Totals for the day are shown in the middle column and a summation of the total rainfall is located at the bottom of this column.
Rainfall Maxima
The right side of the report shows rainfall maxima. These represent the maximum rainfall in a given time period, for the day in question.
- A plus sign (+) next to the time indicates that the time the rainfall ended is on the following day. FlowWorks' system is capable of looking at rainfall over two calendar days - it does not cut-off an event at midnight. This allows you to look at the entire rainfall event.
- At the bottom of the table are total monthly rainfall values for each duration.
0 Comments