
This tool is used for generating printable summary reports of your data in monthly and yearly formats. Each report can include averages, totals and other useful statistics. You can create summary reports for nearly every type of channel you have in FlowWorks.
This report type allows you to include up to three measurements per report.
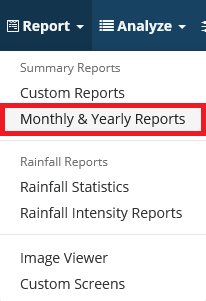
- Click Report from the main toolbar. Then, click Monthly & Yearly Reports.
- For Mode, select Monthly.
The Summary Reports page may refresh to show relevant options.
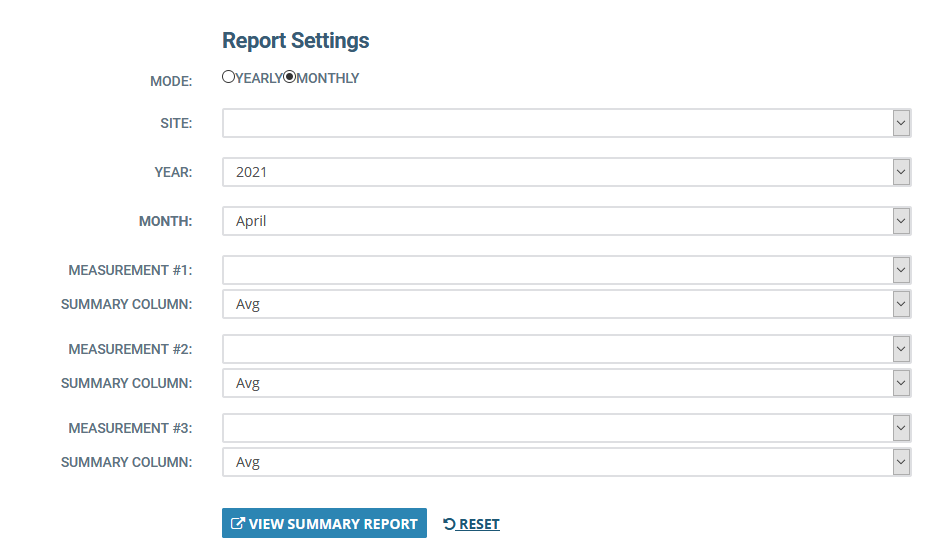
- Choose a Site from the drop-down menu.
- Choose the Year.
- Select the Measurements to include in the report.
Measurement options are typically channels that are associated with the site you selected in Step 3. - For each measurement, choose whether to average or sum-up the measurements. Use the Summary Column menus to make your selection.

- Click View Summary Report.
If the report table does not appear, you may have pop-ups blocked. Please check your web-browser settings and ensure pop-ups from FlowWorks are enabled.
Interpreting the results
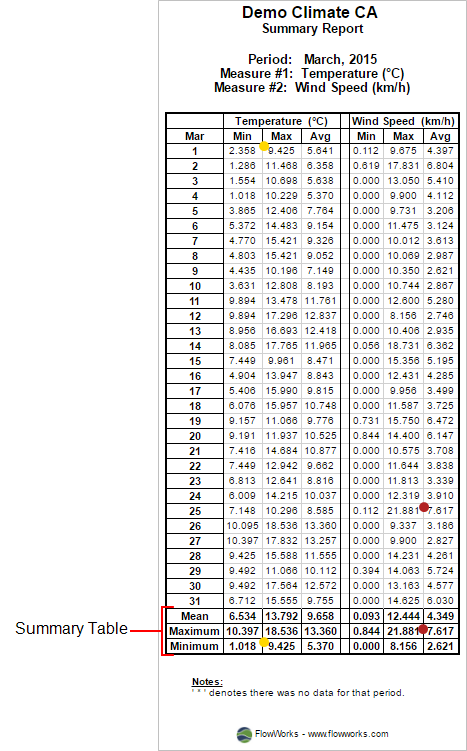
The monthly Report Table (shown below) shows the daily average for each of the selected measurements, for the month of March (2015). The Summary Table at the bottom reports the mean, maximum, and minimum values for the respective column. For example, we see that the lowest recorded temperature occurred on the 4th day of March. Further, the 25th day of March had the highest daily average wind speed.
A yearly report shows the daily average for a given measurement, for each day of the month of the selected year. The summarizing section at the bottom displays the mean, maximum value, minimum value, and the peak 5-minute (or, peak instantaneous) value for the respective month. This report only returns information about a single measurement.
- Click Report from the main toolbar. Then, click Monthly & Yearly Reports.
- For Mode, select Yearly. The Summary Reports page may refresh to show relevant options.

- Choose a Site from the drop-down menu.
- Choose the Year.
- Select the Measurement to include in the report.
Measurement options are typically channels that are associated with the site you selected in Step 3.

- Click View Summary Report.
A separate tab will open in your web browser, from which your report table will appear.
If the report table does not appear, you may have pop-ups blocked. Please check your web-browser settings and ensure pop-ups from FlowWorks are enabled.
Interpreting the results
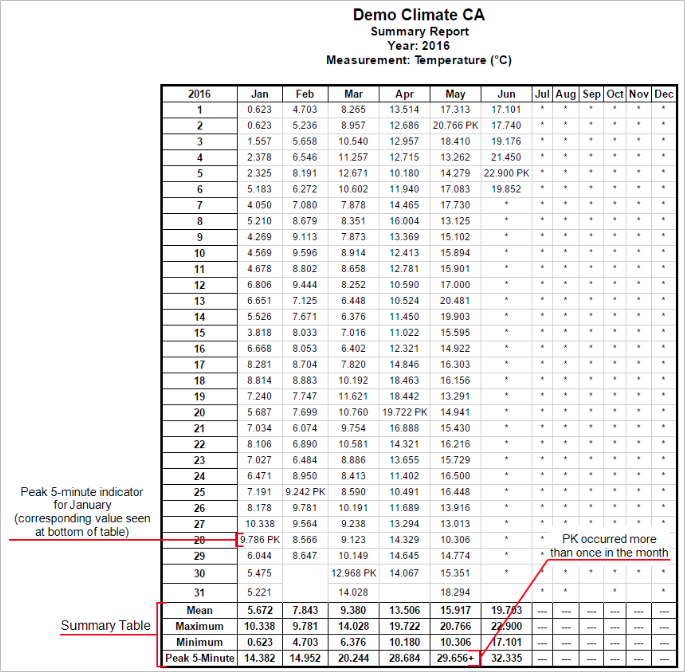
The monthly peak 5-minute value is indicated in the table using a 'PK' abbreviation, next to the corresponding daily average value. The 'PK' indicates that the peak instantaneous value occurred on this day. In the example below, we see that January 28th had a daily average temperature of 9.8°C; the ‘PK” next to it implies that the peak instantaneous value for January occurred on this day. The Peak 5-minute value for the month can be found at the very bottom of the summarizing section of the table.
A '+' sign next to the peak 5-minute value tells us that the temperature reached the peak 5-minute value more than once that particular day. In the example below, we see that in May the peak 5-minute value of 29.65 occurred more than once on May 2nd.
0 Comments