
You may want to change the order in which channels are displayed on a time series graph, or modify which channel is plotted along the x-axis in a scatter plot graph. You may also want to combine certain channels along the same axis, but leave others separate. You can modify the display order of graphed channels from the Options menu, found in the graphing toolbar. This article describes how you can complete these tasks for both time series, and scatter plot graphs.
1. Open the Axis Layout Options Menu
- Begin by plotting a time series or scatter plot graph.
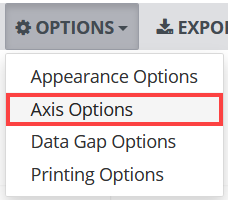
- With your graph open, click Options. A drop-down menu appears.
- Select Axis Options.
2. Choose the Custom Axis Option
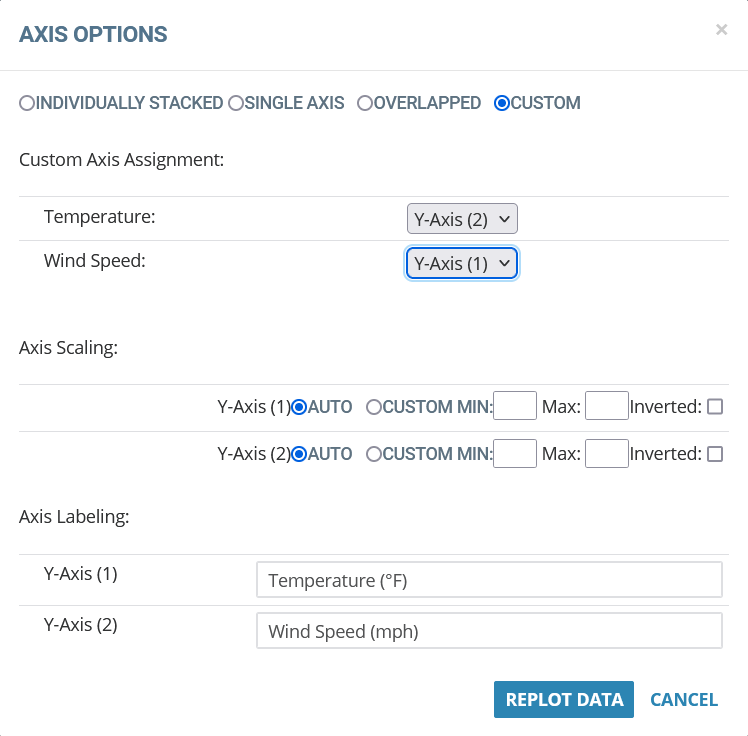
3. Assign each channel to an axis
Use the drop-down menus under Custom Axis Assignment to select an axis on which each of the graphed channels should be plotted. If more than one channel is assigned the same axis, they will appear overlapped.
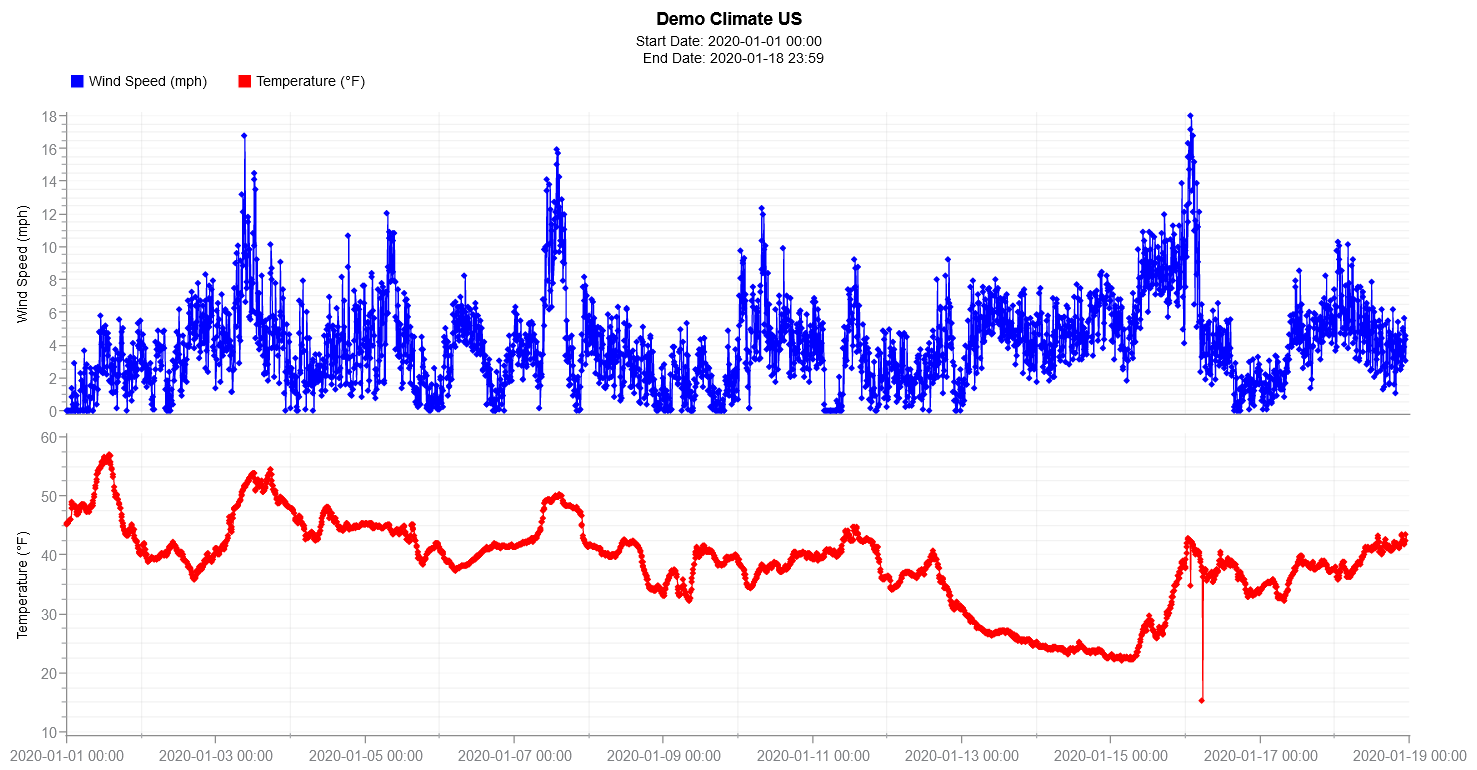
The image below shows a modified axis assignment for a time series.
For scatter plot graphs, you can choose which channel is plotted along the x-axis. The following image shows a modified axis assignment for a scatter plot graph.

4. (Optional) Update Axis Labeling
If you wish to graph more than one channel along the same axis, you may want to change the axis label to something more accurate. Use the Axis Labeling area to make your changes.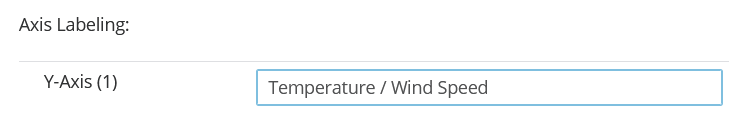
Warning: The axis labeling logic in Axis Settings is set each time you replot the data, but is not dynamically linked to the Custom Axis Assignment. Therefore, if you customize the axis assignment it is necessary to update the axis labels accordingly.
5. Click Replot Data

Remember to save the graph if you wish to keep your changes. See Save a Graph for details.
0 Comments